Explaining the term “resolution” (hereinafter referred to as “resolution”) is like trying to explain the metric system to someone who grew up with inches and feet. If you are not a programmer, but you “passed by” computer science at school, it will be very difficult to understand this issue not easy.
Before we get into "Resolution" we need to find out - What is a pixel.
Pixel- this is an elementary module of an image in digital form that does not have its own linear size. The word "Pixel" is short for picture element(image element). "Digital image files" (not to be confused with the file format) are made up of rows of pixels that fill the height of the file, thereby creating a two-dimensional digital image with dimension px*px. See pixel it is forbidden, you can only see the display of pixel information by the output device. If you open in Adobe Photoshop your favorite picture, and zoom in to 1600%, you will see square areas of the same color, each of them is formed by the computer’s video card based on the information of one pixel. At a viewing scale of 100%, the information of each pixel is used to form color on the smallest possible area of the monitor screen (the size of this area depends on the selected monitor size in the video card driver - the so-called “monitor resolution”), these points create a mosaic that merges into a continuous tone. . The format of digital values and pixels depend on the color representation model (bitmap, Grayscale, RGB, CMYK, Lab, LCH, etc.), the bit depth (depth) of the data (1 bit, 8 bit, 16 bit, 32 bit). For example, for a bitmap this is either 0 or 1, for CMYK - the information is four digits and each digit can take values from 0 to 100 (percentage of paint). These values are rendered by output device drivers.
IN Everyday life a pixel is anything quite “small” that forms “something whole”, for example, print dots or, more often, image dots on a monitor screen, but as soon as we talk about Permission such freedom with respect to the unit of image information - the pixel - is not permissible. A pixel can be thought of, for example, as in the figure below: “something” that carries information about an image in digital form. :)

Another analogy is an Excel table, the cells of which are filled with numbers, one number in the case of a grayscale image, three numbers the cell will contain in the case of an RGB image, in the Commentary such a table must contain information about the color profile, color “depth” (data bit depth - bit) - this will allow you to visualize the table information on the monitor; in the Comments you also need information about the resolution - this will allow you to print the information.
Awareness of the postulate: A pixel is not an image - it is image information It will be a great help in mastering image correction techniques - all manipulations with a digital image are performed on image information, and not on the color and tone of the image.
Resolution units:
Scanner resolution measured in samples per inch ( spi)
Digital Image Resolution, measured in pixels per inch received or intended for output ( ppi)
Output device resolution- in dots per inch ( dpi).
Many people confuse these units of measurement. Scanners and digital cameras create pixels, not dots. However, the pixels will ultimately determine the point values on the output. Point on the output device can be created based on the information:
-each pixel;
-pixel groups
-or a group of points created from a group of pixels.
For example, if an image is 300 pixels long and is output from a printer whose print resolution is 300 dots per inch (dpi), then the image will be one inch long when printed because one dot was created from the information carried by one pixel. The question that arises is:- “How big is the print dot?” For a print device capable of printing 300 dpi, each dot is 1/300 of an inch (0.0846mm). (for example, digital photo printing in a minilab). If you print a file that has 3000 pixels on a side on such a printing device, then one inch of the printed image will appear in the output for each group of 300 pixels in the file. The print size will be 10 inches. If you output the same file to produce a slide using a 1000 dpi film recorder, each dot is 1/1000 of an inch (0.0254 mm). With 3000 pixels in a file, the film recorder will produce one inch of image on the slide for each group of 1000 pixels. The print size will be three inches. In both cases, there are 3000 pixels in the file, but on one output device the image is 10 inches long and on the other it is only 3 inches long. In this situation, the film recorder has a higher resolution than the printer. Digital images do not have a specific physical linear length and width.
Get used to judging the size of a digital image by its file size in MegaBytes. How big is an RGB image that is 2000 x 3000 pixels? -in an uncompressed file format, it takes up 17.2 MB on your hard drive? What are its linear dimensions? The question has no answer as long as the output device is unknown. Create a new image in Photoshop by setting the specified number of pixels. The program will allow you to set the value in the Resolution field to 9999 ppi; files created with different resolutions will be equal in quality and quantity of information.
Let's go back to our Excel table again - we can print 10 rows of cells per page, or 30 rows, or 300 (the master's own hand). If 10 cells on a page look “loose”, the number is too far from the number and we can say that there is not enough information per unit area. In the case of printing 300 rows of cells per page - there is too much information per unit area - we simply will not be able to read the contents - there is too much information. But 30 rows of cells are what you need, the information is compiled into an image, for example this:.
Both lack and excess of information are bad. But this is “bad” only in print, while the “resolution” tag of a digital image on a computer (the number of pixels per unit of length that we allocate for printing the image) does not characterize the image quality in any way.
No democracy
The quality of the Output depends on the quality of the information carried by the pixels in the file. For example: a drum scanner with a maximum resolution of 19,000 spi can easily scan an original with a scan resolution of 300 spi and it would be exactly the size and scan resolution of a $100 flatbed scanner of 300 spi; however, the difference in quality is huge. The same can be said about pixels from digital cameras of various classes. Even if one device is capable of receiving large quantity pixels per inch of the original than another, this does not mean that the quality will be higher. This is especially true digital cameras. Most people who purchase digital cameras determine the number of elements in the camera matrix as their selection criterion and do not pay attention to other aspects that affect quality. There are many factors that affect quality: the CCD and its noise level, the analog-to-digital converter, optics, and file storage formats all affect the quality of the resulting image. For example, currently the resolution of existing optics significantly hinders the development of digital photography. (More about ).
Let's look at a short exercise to illustrate the relationship between image size and output device resolution:
- Let's launch Photoshop.
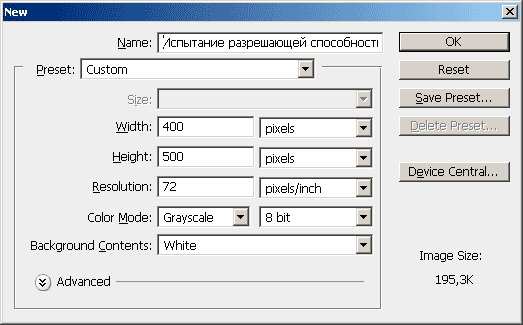
- We create new file by selecting New from the File menu (Cmd/Ctrl N).
- In the pop-up window, name the file "Resolution Test"
- Pay attention to the Width and Height fields. You can define which units to work in - pixels, inches, etc. From the menu, select pixels, and enter 400 in the width field and 500 in the height field. Set the Resolution field to 72 pixels inch.
- Select a mode from the Mode drop-down menu - Grayscale (you can create a CMYK, RGB, or Grayscale file). Later, you will notice that the file size in each of these color spaces is different.
- The Background Contents list allows you to set the background color in a new document. Leave it white.
- Click the OK button.
Monitor, also an output device
So you know how to work in pixels and how to use Photoshop's Image size dialog box. You also know how to change the file resolution. You may be wondering why 72 dpi is such a common resolution. This is because previously most monitor screens had a resolution of 72 dpi (how to determine the resolution of your monitor is written below) and this is an output device, like a printer. Imagine what would happen if you viewed a 2000 x 3000 pixel file in Photoshop. Since the output is eg 72 dpi, the image at 100 percent is so large that you only see part of the full image. This is because each pixel in the file will be displayed as a single dot on the screen, making the image awkward to edit. Luckily, Photoshop allows you to zoom out on an image so you can see it in full. To do this, however, the software must quickly calculate the interpolation for output to the monitor. When you zoom out below 100%, you see an inaccurate image, because each point on the screen is formed based on information from several pixels in the image. Therefore, when working in Photoshop, some operations need to be done at 100% in order to see all the pixels that will be used for printing, for example when you lift images.
In order to find out screen resolution of your monitor create a new file with dimensions of 1 by 1 inch and set the resolution to 100 ppi. Set the viewing scale to 100%, using a regular ruler (wooden or plastic, tape measure or meter - generally a thing, not a tool computer program), use the slider in the Navigator palette to change the scale of the created image until its length becomes equal to one inch (2.54 cm). The resulting scale value is equal to the screen resolution of your monitor. It can be set in Preferences->Units&Rules->Screen Resolution, which will allow using the View->Print Size command to obtain image sizes on the screen equal to those on the print.
Number of "Color channels - per inch"
File 1000 x 1000 - takes up more pixels disk space than a 100x100-pixel file, but files can be composed of color channels, which also affects the physical size of the file, with equal resolution. For example, a 100x100 pixel grayscale file will be one third the size of a 100x100 pixel RGB file. The thing is that an RGB file has three color channels (red, green, blue), one for each color. A CMYK file will be one third as large as an RGB file, . Knowing the file size in pixels, you can always calculate the physical file size in MB for any color reproduction mode. Try this exercise: If you have a file that has 1000 x 1000 pixels, find the area of 1000 times 1000 equals - 1,000,000. This is the total number of pixels in the file. Multiply the resulting number by the number of color channels. For an RGB file it will be: 1000000x3=3000000 bytes. Now, divide 3,000,000 by 1024 to convert to kilobytes (there are 1024 bytes in one kilobyte) and you will get 2929 KB. Divide by 1024 again to get megabytes, and you get 2.86MB. (More about ).
Buyer Beware You Are Being Deceived
You may have seen advertisements and technical descriptions of flatbed scanners, in which the manufacturer tempts you with large resolution numbers. Have you naturally seen the 600 x 1200 dpi specification? You learned that dpi is a misnomer (the scanner has a sample-per-inch-spi setting), but that is a minor inaccuracy compared to the fact that this scanner can only scan at 600 ppi optical resolution. The sensor in a flatbed scanner is a line of CCD (charge-coupled device array), on which the resolution completely depends. In this case, the CCD sensor has 600 three-color elements within one inch, capable of producing 600 pixels per inch. What does the second number do? technical description? It describes the scanner's stepper motor, which moves the CCD up and down the scanner bed. The stepper motor can move the die in 1/1200 inch increments. What happens when scanning at 1200 ppi. The CCD can only capture a maximum of 600 pixels per inch, moving in 1/1200 inch increments produces rectangular shaped samples and the scanner software calculates from the resulting samples a pixel value that will be written to the image file. There is often a recommendation to scan with a resolution that is a multiple of the maximum optical resolution of the scanner - this would be true only in one case - physically turning off the “unused” CCD elements, which is not implemented in any scanner. Therefore, scan at the resolution necessary to obtain the file sizes you need (not exceeding the maximum optical resolution of the scanner).
To insert into the text of someone else's manuscript or not?
If you need to create a file that requires a scan resolution higher than your scanner can handle, you can let the scanner do the "padding" or you can do the "padding" (interpolate, enlarge) in Photoshop or another program. ? It all depends on the interpolation algorithm that the scanner software uses. As a rule, Bicubic interpolation (and its variant with anti-aliasing) used in Photoshop provides the best quality result. There are programs that use complex mathematical interpolation algorithms, the results of which are slightly better than Photoshop. Few scanner manufacturers will tell you the interpolation type - Bicubic, or a faster but lower quality algorithm. I recommend the following test: scan the original at the maximum optical resolution of the scanner, and interpolate in Photoshop at 400%. Scan again without changing anything except the scale - increase it four times. Open both images in Photoshop. Shift-drag the Background layer into the second image window and change the layer's blending mode to Difference. If there is no image and the screen is completely black, then there are no differences in the images, but if there are differences, then you need to determine which image is better - in eight cases out of ten, the image enlarged in Photoshop is better. But scanning programs are constantly being improved and it’s always a good idea to check. Let's return to our task -
At what resolution should I scan an image for different printing conditions?
High-quality scanner software calculates the required scanning resolution using the formulas presented below, already integrated into the program. All you have to do is: enter the desired linear printout size or magnification scale; output resolution (tag value - resolution that will be written to the file) or increasing factor and raster lineature. Software will take care of the rest. For those of you who would like to learn the exact formulas, here is everything you need to calculate scan resolution for the most commonly used printing processes. For printers that can produce continuous tones (Like a thermosublimation printer), you can calculate the required resolution using the following method:
Scan Resolution = Print Resolution x Zoom Factor
The required dimensions are determined and they are different from the original. For example: You need to scan an original that is 1x1 inches. The original is too small, so you decide to enlarge it to 3x3 inches and print "it" on your 300 dpi printer. The following calculation results:
Scan resolution = 300 dpi x 3=900 ppi
Scanning for offset printing
The story is the same - you want to scan a grayscale or color original. If you want to print an image for example for use in a magazine; the following formula to calculate scan resolution:
Scan Resolution = Printout’s Screen Ruling x Screening Factor x Sizing Factor
Scan resolution=Print lineature*Increasing factor*Coefficient. scaling
In offset printing, the information from one pixel of an image is not enough to produce one halftone dot, so you must include a Screening Factor in the equation. This coefficient increases the image resolution and allows the output device (Rip - raster processor) to calculate the values for the raster dots more accurately. If you are not familiar with other values for specific printing conditions of specific scene types of images, use a Factor equal to two. Then the color of each raster dot on print will be calculated based on the values of four pixels (2x2 matrix) (in reality, the calculation is much more complex than simply averaging the values of the pixels provided to form a unit of print length, many factors are taken into account, such as raster rotation angles, and the significance is first of all the number of pixels required to form one halftone dot), Back to our example, if we still want to print our 1x1 inch image with dimensions of 3x3 inches, but this time for offset printing purposes at a print lineature of 150 Lpi, we must calculate scanning resolution:
Lineature = 150 lpi
Screening Factor = 2
Magnification scale = 3
Scan resolution = 150 lpi x 2 x 3 = 900 ppi
Recommendations for image resolution for various image output technologies (minimum-maximum)
- Monitor- resolution does not matter - the size is determined by the pixel size of the image
- Home Printer- 180-360ppi (You can view the driver settings with which I recommend printing on Epson printers)
- Mini darkroom- 150-300ppi is a “continuous tone” printing technology - each printing point is formed by the information of one pixel - there is no rasterization, as in other printing technologies. And the human eye is not able to see from a viewing distance of 20-30 cm points located with a frequency above 150 dots per inch.
- Offset printing with high lineature printing (150-175lpi) - 240-350ppi the choice depends on the quality of the image and its subject, for example, high-frequency images (having high and contrasting detail) can have (for the benefit of quality) a resolution of up to 1200ppi, and most photos taken with a digital camera can be Leave it at 240ppi - higher values will not add anything to the playback quality.
- Digital large format printing- the required resolution depends entirely on the print resolution (the number of drops-dots per unit length) of the plotter and is equal to a quarter of it, for example, with a print resolution of 600dpi - the image only needs to have a resolution of 150ppi, which corresponds to the quality of interior large-format printing (with dimensions up to 3 meters) . For street banners, a resolution of no more than 72ppi is needed, often 24-36ppi is sufficient. But the viewing distance, which is often referred to when explaining the required image resolution for a banner, plays a role when choosing the necessary equipment - based on the size of the required printing point, a plotter is selected (and not the one that is in the office around the corner), an image with 150ppi There will be no interior quality when printing with a print resolution of 360 pixels, it will be the same as printing an image with a resolution of 72ppi. Only by choosing necessary equipment You can determine by its characteristics the necessary and sufficient image resolution.
Below is a table of file sizes in megabytes for various color models (you can see MB in the Image Size dialog. In TIF format it is equal to the file size), for standard paper sizes.
Raster representation of images exists not only in digital form. A monitor or TV screen and a printed illustration also consist of individual elements - pixels or dots.
There are four resolutions to consider when working with raster images. This resolution of scanner, monitor, printer, as well as directly Images, saved as a file (graphics resolution). The first three quantities are technical characteristics specific devices, and them maximum values limited.
Graphic Resolution
The resolution of an image saved as a file is called graphics resolution. It is measured in PPI(pixels per inch) - pixels per inch and determines how many pixels per unit of measurement the image consists of. Theoretically, the value of graphic resolution is not limited, since it is not linked to technical means(scanner, printer, phototypesetting machine, etc.)
Scanner resolution
Scanning an image is converting it from analog to digital form and transferring it to a computer using a special device - a scanner. The frequency with which a scanner reads information per unit length is called resolution, or scanner resolution. Typically scanner resolution is measured in SPI(samples per inch) - samples per inch , or in PPI, although the term DPI (dots per inch) is often used in documentation - dpi , which is in in this case technically incorrect.
Monitor resolution
The monitor screen is covered with tiny phosphor dots of red, blue and green colors, forming the so-called monitor pixel. A beam of electrons hits these points, causing them to glow. By controlling the beam power for each phosphor point, you can change the brightness and color of the image on the screen. Monitor resolution is measured in pixels per inch and depends on the specific monitor and video card.
Printer resolution
Determines its ability to separately print the number of dots per unit length. Measured in dpi . The higher the resolution of the printing device, the higher the image quality that can be obtained on it.
Basic concepts of raster graphics
Image resolution and size
The main element bitmap is a point. If the image is on-screen, then this point is called a pixel. Depending on the graphic resolution of the screen the computer operating system is configured for, images with 640x480, 800x600, 1024 or more pixels can be placed on the screen.
The size of the image is directly related to its resolution. This parameter is measured in dots per inch (dpi). For a 15-inch diagonal monitor, the image size on the screen is approximately 28x21 cm. Knowing that there are 25.4 mm in one inch, we can calculate that when the monitor operates in 800x600 pixel mode, the screen image resolution is 72 dpi.
When printing, the resolution must be much higher. Polygraphic printing of a full-color image requires a resolution of at least 300 dpi. A standard 10x15cm photograph should contain approximately 1000x1500 pixels.
In computer graphics, the concept of resolution tends to be the most confusing, since we have to deal with multiple properties of different objects at once. It is necessary to clearly distinguish between screen resolution, printing device resolution and image resolution. All these concepts refer to different objects. These types of resolutions are in no way related to each other, until you need to know what physical size the picture on the monitor screen, print on paper or file on the hard drive will have.
Screen resolution- this is a property computer system(depending on the monitor and video card) and operating system. Screen resolution is measured in pixels and determines the size of the image that can fit entirely on the screen.
Printer resolution is a printer property that expresses the number of individual dots that can be printed on a unit length area. It is measured in units of dpi (dots per inch) and determines the size of an image at a given quality or, conversely, the quality of an image at a given size.
Image Resolution is a property of the image itself. It is also measured in dots per inch and is set when creating an image in a graphics editor or using a scanner. The image resolution value is stored in the image file and is inextricably linked to another property of the image - its physical size.
The physical size of an image can be measured in both pixels and length units (millimeters, centimeters, inches). It is set when the image is created and is stored with the file.
If an image is being prepared for display on a screen, then its width and height are specified in pixels in order to know how much of the screen it occupies.
If an image is being prepared for printing, then its size is specified in length units in order to know how much of the sheet of paper it will occupy. It is not difficult to convert the image size from pixels to length units or vice versa if the image resolution is known.
The relationship between the linear size of the illustration and the file size at print resolutions is given in table. 1.
Table 1.
|
Print size |
||||
|
10x15 cm (photograph) |
||||
|
25x30 cm (magazine cover) |
||||
|
50x30 cm (magazine spread) |
3.80 MB |
The relationship between illustration size (in pixels) and print size (in mm) at print resolutions is shown in table. 2.
Table 2.
|
Illustration size |
||||
Lecture 3
Basic concepts of CG
Image resolution and size
There should be a clear distinction between screen resolution, printer resolution, and image resolution. All these concepts refer to different objects. These types of resolutions are in no way related to each other, until you need to know what physical size the picture on the monitor screen, print on paper or file on the hard drive will have.
Screen resolution– a property of a computer video system (depending on the parameters of the monitor and video card) and the operating system (depending on the settings Windows ). Screen resolution is measured in pixels per inch ( ppi - pixel per inch ) and determines the size of the image that can be placed on the screen entirely.
Printer resolution– a printer property that expresses the number of individual dots that can be printed on a unit length area. It is measured in units dpi (dots per inch – dots per inch) and determines the size of the image at a given quality or, conversely, the quality of the image at a given size.
Image Resolution– a property of the image itself. It is measured in dots per inch ( dpi ) and is set when creating an image in a graphics editor or using a scanner. The image resolution value is stored in the image file and is inextricably linked to another property of the image - its physical size.
Physical Image Size. Can be measured both in pixels and in units of length (millimeters, centimeters, inches). It is set when the image is created and is stored with the file.
If an image is being prepared for display on a screen, then its width and height are specified in pixels in order to know how much of the screen it occupies. If an image is being prepared for printing, then its size is specified in length units in order to know how much of the sheet of paper it will occupy. It is not difficult to convert the image size from pixels to length units and vice versa if the image resolution is known (see table).
The relationship between illustration size (in pixels) and size
imprint (in mm) at different print resolutions
| Size | Print size, mm at resolutions |
|||
| 75 dpi | 150 dpi | 300 dpi | 600 dpi |
|
| 640x480 | 212x163 | 108x81 | 55x40 | 28x20 |
| 800x600 | 271x203 | 136x102 | 68x51 | 34x26 |
| 1024x768 | 344x260 | 173x130 | 88x66 | 44x33 |
| 1152x864 | 390x292 | 195x146 | 98x73 | 49x37 |
| 1600x1200 | 542x406 | 271x203 | 136x102 | 68x51 |
Raster concept
The emergence and widespread use of the raster is based on the ability of human vision to perceive an image consisting of individual dots as a single whole. This feature of vision has been used by artists for a long time. Printing technology is also based on it.
The image is projected onto a light-sensitive plate through glass on which an opaque raster grid is uniformly applied. As a result, the continuous halftone image is broken into individual cells called raster elements. The raster has become widespread in the manufacture of various types of printed products: newspapers, magazines, books.
The concept of a continuous halftone image comes from photography. In fact, a photographic print, when viewed through an optical device with very high magnification, also consists of individual elementary dots. However, they are so small that they are indistinguishable to the naked eye.
Other methods of presenting images: printing, printing, displaying on a monitor - use relatively large raster elements.
Screening methods
In printing, the density of filling a raster element with black ink determines the perception of a given point on the print as lighter or darker. Thus, the tone intensity is adjusted by changing the size of the raster dot: the darker the dot on the print, the greater the degree of filling of the raster cells with black ink. This method is called amplitude modulation rasterization.
The intensity of the tone can be adjusted by changing the number of black dots of the same size placed in the raster cell. This method is called frequency modulation rasterization.
If the black dots are located randomly within the raster cell, the method is called stochastic rasterization.
Tone intensity(lightness) is usually divided into 256 levels, i.e. To reproduce the entire halftone range, it is enough that the raster cell size is 16x16 pixels. There should be so many such cells superimposed on the image so that any small details of the image do not disappear. Therefore, the more raster cells there are in each row, the more high quality we will receive the image when printing.
The distance between the centers of raster cells is the same; their number per unit length is called raster lineature and is measured in lines per inch ( lpi - lines per inch ). The higher the value lpi raster, the sharper the image looks, since small details fall into several raster cells. Modern high-quality printing equipment can have a raster lineature of up to 300 lpi . When printing on a printer, the raster lineature is about 65-90 lpi.
In printing, the raster grid is usually rotated at an angle of 45˚ (for black paint). This is due to the ability of the human eye to fix lines close to vertical or horizontal. When using color printing, the rotation angle may be different depending on the number of colors.
The raster lineature must be taken into account when printing an image on a printer. To obtain a high-quality image, you need to know the relationship between lineature, resolution and tonal range.
Currently, digital devices (scanners, photo and video cameras) are mainly used to input images. These devices are characterized by a constant spot size. Therefore, to fill a raster cell that falls in a dark area of the image, many spots of the same size are placed in it. Such spots are called dots. The maximum number of dots of the same size that can fit in a segment of a fixed length (vertically or horizontally) of a print is called the resolution of the printing device. The unit of measurement is dpi . For example, printer resolution is 600 x 1200 dpi (horizontal resolution – 600, vertical – 1200).
The tonal range, screen lineature and resolution of the printing device are related by the following relationship:
Basics of Color Theory
When working with color, the concepts of color resolution (also called color depth) and color model are used. Color resolution determines how color information is encoded and determines how many colors a screen can display at once. To encode a two-color (black and white) image, it is enough to allocate one bit to represent the color of each pixel. Allocation of one byte allows you to encode 256 different colors. Two bytes (16 bits) allow you to define 65536 different colors. This mode is called High Color . If three bytes (24 bits) are used to encode color, 16.5 million colors can be displayed simultaneously. This mode is called True Color.
Colors in nature are rarely simple. Most color shades are formed by mixing primary colors. The method of dividing a color shade into its components is called a color model. There are many various types color models, but in computer graphics, as a rule, no more than three are used. These models are known as RGB, CMYK and HSB.
Color is one of the factors in our perception of light radiation. The following attributes are used to characterize color.
Color tone. Can be determined by the predominant wavelength in the radiation spectrum. Hue allows you to distinguish one color from another, for example, green from red, yellow and others.
Brightness. Determined by energy, intensity of light radiation. Expresses the amount of light perceived.
Saturation or purity of tone. Expressed as the proportion of white present. In an ideally pure color there is no white admixture. If, for example, white color is added to a pure red color in a certain proportion (artists call this whitening), the result will be a light, pale red color.
These three attributes allow you to describe all colors and shades. The fact that there are exactly three attributes is one of the manifestations of the three-dimensional properties of color.
The science that studies color and its measurements is called colorimetry. It describes the general patterns of human color perception of light.
One of the basic laws of colorimetry is the laws of color mixing. These laws were formulated in their most complete form in 1853 by the German mathematician Hermann Grassmann:
1. Color is three-dimensional - three components are needed to describe it. Any four colors are linearly related, although there are an unlimited number of linearly independent sets of three colors.
In other words, for any given color (C), you can write the following color equation, expressing the linear dependence of colors:
C = k 1 C 1 + k 2 C 2 + k 3 C 3,
where C 1, C 2, C 3 are some basic, linearly independent colors, coefficients k 1, k 2, and k 3 are the amount of the corresponding mixed color. The linear independence of the colors Ts 1, Ts 2, Ts 3 means that none of them can be expressed as a weighted sum (linear combination) of the other two.
The first law can be interpreted in a broader sense, namely in the sense of the three-dimensionality of color. It is not necessary to use a mixture of other colors to describe a color; you can use other values, but there must be three of them.
2. In a mixture of three color components, if one changes continuously while the other two remain constant, the color of the mixture also changes continuously.
3. The color of the mixture depends only on the colors of the components being mixed and does not depend on their spectral compositions.
Hardware computer graphics, printing
1. Permission: types of permits. Differences.
Resolution is the degree of detail in an image, the number of pixels allocated per unit area. Therefore, it makes sense to talk about image resolution only in relation to any image input or output device. For example, while there is an ordinary photograph on hard media, one cannot say about its resolution. But as soon as we try to enter this photo into the computer through a scanner, we will need to determine the resolution of the original, that is, indicate the number of dots that the scanner can read from one square inch .
Since the image can be viewed in relation to various devices, then one should distinguish:
screen resolution,
resolution of the printing device,
image resolution.
Screen resolution is a property of the computer system (depends on the monitor and video card) and the operating system (for example, depends on Windows settings). Screen resolution is measured in pixels and determines the size of the image that can fit entirely on the screen. Screen resolution - 72 pixels per inch.
Printer resolution is a property of the printer that expresses the number of individual dots that can be printed in a unit length area. It is measured in dpi units (abbr. dpi - dot per inch - dots per inch) and determines the size of the image at a given quality or, conversely, the quality of the image at a given size.
Image resolution is a property of the image itself. It is also measured in dots per inch and is set when creating an image in a graphics editor or using a scanner. The higher the image resolution, the larger the image file size. For the Web, the screen resolution used is 72 dpi. The image resolution value is stored in the image file and is inextricably linked to another property of the image - its physical size.
The physical size of an image can be measured in both pixels and length units (millimeters, centimeters, inches). It is set when the image is created and is stored with the file. If an image is being prepared for display on a screen, then its width and height are specified in pixels in order to know how much of the screen it occupies. If an image is being prepared for printing, then its size is specified in length units in order to know how much of the sheet of paper it will occupy.
An important characteristic of a screen image is resolution. Permission is the number of pixels per this image. It is measured in pixels per inch (dots per inch) – dpi . The higher the resolution, the better image quality, but more of his file. The standard is 72 pixels per inch (screen resolution). The screen and printing device have their own resolutions.
computer graphics with concept permission Several properties of different objects are associated. There are: screen resolution, print resolution, image resolution
permission
screen
is a property
computer system (depending on the monitor
and video card) and operating system. Measured
in pixels and determines the size of the image,
which can fit entirely on the screen.
permission print is a printer property that expresses the number of individual dots that can be printed on a unit length area. It is measured in dpi (dots per inch) and determines the size of an image at a given quality or the quality of an image at a given size.
permission
Images
–
it is a property of the image itself. It too
measured in dots per inch and specified during creation in
graphic editor or using a scanner.
The image resolution value is stored in
file with the image and is inextricably linked with its
physical size
(sometimes called color depth) defines the method by which color information is encoded and determines how many colors a screen can display at once.
To encode a two-color (black and white) image, it is enough to allocate one bit to represent the color of each pixel. Allocation of one byte allows you to encode 256 different shades. Two bytes (16 bits) allow you to define 65536 different colors.
This mode is called High Color
. If three bytes (24 bits) are used to encode color, 16.5 million colors can be displayed simultaneously. This mode is called True Color.
Colors in nature are rarely simple. Most color shades are formed by mixing primary colors. The method of separating a color shade into its component components is called color
model
.
There are many different types of color models. In computer graphics, three are most often used: RGB, CMYK, HSB.
IN graphic editors funds are available
to convert images from one
color model to another.
Color models
RGB color model
The RGB model describes the colors emitted and is based on three basic (primary) colors - Red, Green, Blue. The remaining colors are formed by mixing these three primary colors. When adding (mixing) two rays of primary colors, the result is lighter than the components. Colors of this type are called additive .
Combining the three components gives a neutral
color (gray), which at high brightness
tends towards white.
This matches what we see in
monitor screen, so this model is used
whenever an image is being prepared,
intended for display on screen.
CMYK color model
Used to prepare printed images. They
differ in that they are seen in reflected light.
The more paint you put on the paper, the more light there is.
it absorbs and reflects less. Combination of three
primary colors absorb almost all incident light, and
From the side, the image looks almost black. IN
difference from the RGB model increased amount of paint
does not lead to an increase in visual brightness, but, on the contrary,
to its reduction. Therefore, to prepare printed
images are not used additive
(summing), and subtractive
(subtractive) model.
The color components of this model are not
primary colors, and those that are obtained
resulting from subtracting the primary colors from white:
Cyan = white – red = green + blue
Magenta = white – green = red + blue
Yellow = white – blue = red + green
HSB color model
HSB is a very easy to understand model that computer artists often work with. It is based on the colors of the RGB model, but has a different coordinate system. Any color in the HSB model is defined by its hue (the color itself), saturation (that is, the percentage of white ink added to the color) and luminance (the percentage of black ink added). This model was named after the first letters of the English words Hue, Saturation, Brightness, - HSB. Thus, the model has three color channels.
Spectral colors (pure colors of the solar spectrum) or color tones (hue) are located along the edge of the color wheel and are characterized by a position on it, which is determined by the angle in the range from 0 to 360 degrees. These colors have maximum saturation and brightness (100%). Saturation varies along the radius of the circle from 0 (in the center) to 100% (at the edges). A saturation value of 0% makes any color white.
In the HSB model, any color is obtained from the spectral color by adding a certain percentage of white and black paints, i.e., actually gray paint.
2. CRT and LCD monitors. Scan.
CRT monitors
Cathode-ray tube (CRT), kinescope - vacuum device, converting electrical signals into light.
In a strict sense, cathode ray tubes are called row electron beam devices, one of which is a kinescope.
Basic device:
electron gun, designed to form an electron beam, in color picture tubes and multi-beam oscillographic tubes they are combined into an electron-optical spotlight;
screen covered phosphor- a substance that glows when a beam of electrons hits it;
deflection system controls the beam in such a way that it forms the required image.
History of development
IN 1859Julius Plücker opened cathode rays. IN 1879William Crooks created a prototype of an electron tube, established that cathode rays propagate linearly, but can deviate magnetic field. He also discovered that when cathode rays hit some substances, the latter begin to glow.
IN 1895 German physicist Karl Ferdinand Braun based on the Crookes tube, he created a cathode tube, called Brown tubes. The beam was deflected magnetically in only one dimension, the second direction was deployed using a rotating mirror. Brown decided not to patent his invention and gave many public demonstrations and publications in the scientific press. Brown's tube was used and improved by many scientists. IN 1903Arthur Wehnelt placed a cylindrical electrode in the tube ( Wehnelt cylinder), allowing you to change the intensity of the electron beam, and, accordingly, the brightness of the phosphor.
IN 1905Albert Einstein published the equation of external photoelectric effect, open in 1877Gengikh Hertz, and researched Alexander Grigorievich Stoletov.
IN 1906 Brown's collaborators M. Dickman and G. Glage received a patent for the use of Brown's tube for transmitting images, and in 1909 M. Dickmann proposed in his article a phototelegraph device for transmitting images using a Brown tube; the scanning device used Nipkow disk.
Since 1902 he has been working with Brown's tube Boris Lvovich Rosing. July 251907 He filed an application for the invention “Method of electrically transmitting images over distances.” The beam was scanned in the tube magnetic fields, and modulation of the signal (change in brightness) using a capacitor, which could deflect the beam vertically, thereby changing the number of electrons passing to the screen through the diaphragm. IN 9th May1911 at the meeting Russian Technical Society Rosing demonstrated the transmission of television images of simple geometric figures and their reception with reproduction on a CRT screen.
At the beginning and middle of the 20th century, a significant role in the development of CRTs was played by Vladimir Zvorykin, Allen Dumont and others.
Design and principle of operation
General principles
Black and white kinescope device
In a cylinder 9 created deep vacuum- first the air is pumped out, then all the metal parts of the kinescope are heated inductor to release absorbed gases, to gradually absorb remaining air getter.
To create an electron beam 2 , a device called electron gun. Cathode 8 , heated by filament 5 , emits electrons. To increase electron emission, the cathode is coated with a substance that has low work function(the largest CRT manufacturers use their own for this patented technologies). By changing the voltage on the control electrode ( modulator) 12 you can change the intensity of the electron beam and, accordingly, the brightness of the image (there are also models with cathode control). In addition to the control electrode, the gun of modern CRTs contains a focusing electrode (until 1961, domestic picture tubes used electromagnetic focusing using a focusing coil 3 with core 11 ), designed to focus a spot on the kinescope screen into a point, an accelerating electrode for additional acceleration of electrons within the gun and anode. After leaving the gun, the electrons are accelerated by the anode 14 , which is a metallized coating of the inner surface of the kinescope cone, connected to the gun electrode of the same name. In color picture tubes with an internal electrostatic screen, it is connected to the anode. In a number of picture tubes of early models, such as 43LK3B, the cone was made of metal and represented the anode itself. The voltage at the anode ranges from 7 to 30 kilovolts. In a number of small-sized oscillographic CRTs, it is only one of the electrodes of the electron gun and is powered by voltages of up to several hundred volts.
The beam then passes through deflection system1 , which can change the direction of the beam (the figure shows a magnetic deflection system). IN television CRTs use a magnetic deflection system as it provides large deflection angles. IN oscillographic CRTs use an electrostatic deflection system as it provides greater performance.
The electron beam hits the screen 10 , covered phosphor4 . Bombarded by electrons, the phosphor glows and a rapidly moving spot of variable brightness creates an image on the screen.
The phosphor acquires a negative charge from electrons, and secondary emission- the phosphor itself begins to emit electrons. As a result, the entire tube acquires a negative charge. To prevent this from happening, there is a connection across the entire surface of the tube. body layer aquadaga- conductive mixture based graphite (6 ).
The kinescope is connected through the leads 13 and high voltage socket 7 .
In black-and-white TVs, the composition of the phosphor is selected so that it glows in a neutral gray color. In video terminals, radars, etc., the phosphor is often made yellow or green to reduce eye fatigue.
Beam angle
The deflection angle of the CRT beam is the maximum angle between two possible positions of the electron beam inside the bulb at which a luminous spot is still visible on the screen. The ratio of the diagonal (diameter) of the screen to the length of the CRT depends on the angle. For oscillographic CRTs it is usually up to 40 degrees, which is due to the need to increase the sensitivity of the beam to the effects of deflection plates. For the first Soviet picture tubes with a round screen it was 50 degrees, for black-and-white picture tubes of later releases it was 70 degrees, and starting in the 60s it increased to 110 degrees (one of the first such picture tubes was 43LK9B). For domestic color picture tubes it is 90 degrees.
Ion trap
Since it is impossible to create a perfect vacuum inside the CRT, some air molecules remain inside. When colliding with electrons from them are formed and he, which, having a mass many times greater than the mass of electrons, practically do not deviate, gradually burning out the phosphor in the center of the screen and forming the so-called ion spot. To combat this until the mid-60s. were used ion trap. At the beginning of the 60s. was developed new way phosphor protection: aluminizing the screen, which also doubled the maximum brightness of the kinescope.
Scan
To create an image on the screen, an electron beam must constantly pass across the screen with high frequency- at least 25 times per second. This process is called sweep. There are several ways to scan an image.
Raster scan
The electron beam passes the entire screen in rows. There are two options:
1-3-5-7-…, then 2-4-6-8-… ( interlace scanning).
Interlace scanning- method of display, transmission or storage images(usually, moving), at which each frame breaks into two half frame(or fields), composed of lines selected one after another.
An alternative scan option is progressive scan.
Interlace scanning is used, in certain cases, to speed up image output with limited bandwidth(V analog) or channel width(in digital technology). In a video signal, while maintaining the number of image lines, the use of interlaced scanning increases by 2 times frame rate compared to progressive.
1-2-3-4-5-… (progressive scanning);
Progressive scan- a method of displaying, transmitting or storing moving images in which all the lines of each frame are displayed sequentially.
This scanning method is different from interlace scanning, used in traditional television, where all odd lines are transmitted first, and then all even lines (the part of the picture consisting of even or odd lines is called half frames or fields).
Vector scan
The electron beam passes along the image lines.
See also: Vectrex- the only game console with vector scanning.
Vectrex- 8-bit game console developed by General Consumer Electric (GCE), later purchased Milton Bradley Company. Vectrex is unique in that it is the only gaming system, using vector graphic monitor; no other system, before or after it, used a similar configuration. Vertex was sold to consumers from 1982 year priced at $199; sales of the device stopped in 1984 , during a downturn in the game console market.
Unlike other gaming consoles that connect to your home TV for transmission raster images (i.e. game consoles), "Vectrex" had its own built-in monitor, depicting vector graphics. The monitor was monochrome, but a translucent colored film was applied to the screen, different for each game, which gave the illusion of color and also reduced the effect of image flickering inherent in vector monitors.
One game was built into the system - “Mine Storm” (something like a classic arcade game Asteroids), other games were shipped on cartridges.
Scan on screenradar
The electron beam passes along radii screen. Service information (map, labels) is additionally expanded in raster or vector ways.
Color picture tubes
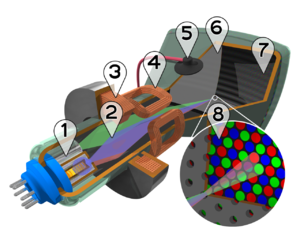
Color kinescope device. 1 - Electron guns. 2 - Electron rays. 3 - Focusing coil. 4 - Deflection coils. 5 - Anode. 6 - A mask, thanks to which the red beam hits the red phosphor, etc. 7 - Red, green and blue phosphor grains. 8 - Mask and phosphor grains (enlarged).
A color kinescope differs from a black and white one in that it has three guns - “red”, “green” and “blue” ( 1 ). Accordingly, on the screen 7 three types of phosphor are applied in some order - red, green and blue ( 8 ).
Only the beam from the red gun hits the red phosphor, only the beam from the green gun hits the green one, etc. This is achieved by installing a metal grid between the guns and the screen, called mask (6 ). The mask is made from invara- varieties become with a little coefficient of thermal expansion.
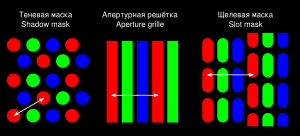
Types of masks
There are two types of masks:
actually a shadow mask. There are two types:
Shadow mask for picture tubes with a delta-shaped arrangement of electron guns. Often, especially in translated literature, it is referred to as shadow grid(found in picture tubes from most manufacturers);
Shadow mask for picture tubes with planar arrangement of electron guns. Also known as slotted grating (LGFlatron).
aperture lattice (SonyTrinitron, MitsubishiDiamondtron). This mask, unlike other types, consists of large quantity wired, stretched vertically;
There is no clear leader among these masks: the shadow one provides high quality lines, the aperture one gives more saturated colors. Slit combines the advantages of shadow and aperture, but is prone to moiram.
Types of gratings, methods of measuring pitch on them
The smaller the phosphor elements, the higher the image quality the tube can produce. An indicator of image quality is mask step.
For a shadow grating, the mask pitch is the distance between the two nearest mask holes (accordingly, the distance between the two closest phosphor elements of the same color).
For aperture and slot gratings, the mask pitch is defined as the horizontal distance between the mask slits (respectively, the horizontal distance between vertical phosphor strips of the same color).
In modern CRTs, the mask pitch is 0.25 mm.
Convergence of rays
Main article: Convergence of rays
Since the radius of curvature of the screen is much greater than the distance from it to the electron-optical system up to infinity in flat picture tubes, and without the use of special measures, the point of intersection of the rays of a color picture tube is at a constant distance from the electron guns, it is necessary to ensure that this point is located exactly at surface of the shadow mask, otherwise a misalignment of the three color components of the image will occur, increasing from the center of the screen to the edges. To prevent this from happening, the electron beams must be properly biased. In picture tubes with a delta-shaped arrangement of guns, this is done by a special electromagnetic system, controlled separately by a device, which in old televisions was placed in a separate block - the mixing block - for periodic adjustments. In picture tubes with a planar arrangement of guns, adjustment is made using special magnets located on the neck of the picture tube. Over time, especially for picture tubes with a delta-shaped arrangement of electron guns, the convergence is disrupted and requires additional adjustment. Most computer repair companies offer a monitor reconvergence service.
Software computergraphics 10 Kindscomputergraphics ...
15 1 basics of presenting graphic data types of computer graphics
Document... -hardware computing systems, - computergraphic arts. She covers everything kinds ... is different portability between platforms (IBMPC and Apple Macintosh), secured...colors B computergraphics apply the concept of color permissions(other...
Lecture notes Lecture 1 Introduction to computer graphics Main areas of computer graphics
AbstractIntroduction to computergraphics 1 Main directions computergraphics 1 Classification computergraphics 3 Business graphic arts 4 Lecture 2 4 Kindscomputergraphics. Software computergraphics 4